Observability at scale: from scoping to team self-sufficiency
From scoping to continuous improvement in operations, field experience on deploying observability and helping teams become self-sufficient.

Deploying an observability platform at scale involves organizational change as well as technology. Our field experience shows a recurring pattern: early enthusiasm meets the constraints of existing systems and resistance to change. Our role is to help teams work through this stage, develop useful practices and become progressively self-sufficient.
Keep business priorities in view throughout the project
At Phenisys, we connect project scoping with priority use cases: tracking a business process end to end, understanding application performance issues or extending visibility to networks and logs. A shared roadmap guides deployment and helps teams rationalize their use cases when the first difficulties arise.
Advisory work continues through integration: building the foundation, defining good practices, connecting existing repositories and gradually extending coverage. The path depends on client priorities and the teams’ ability to adopt each step.
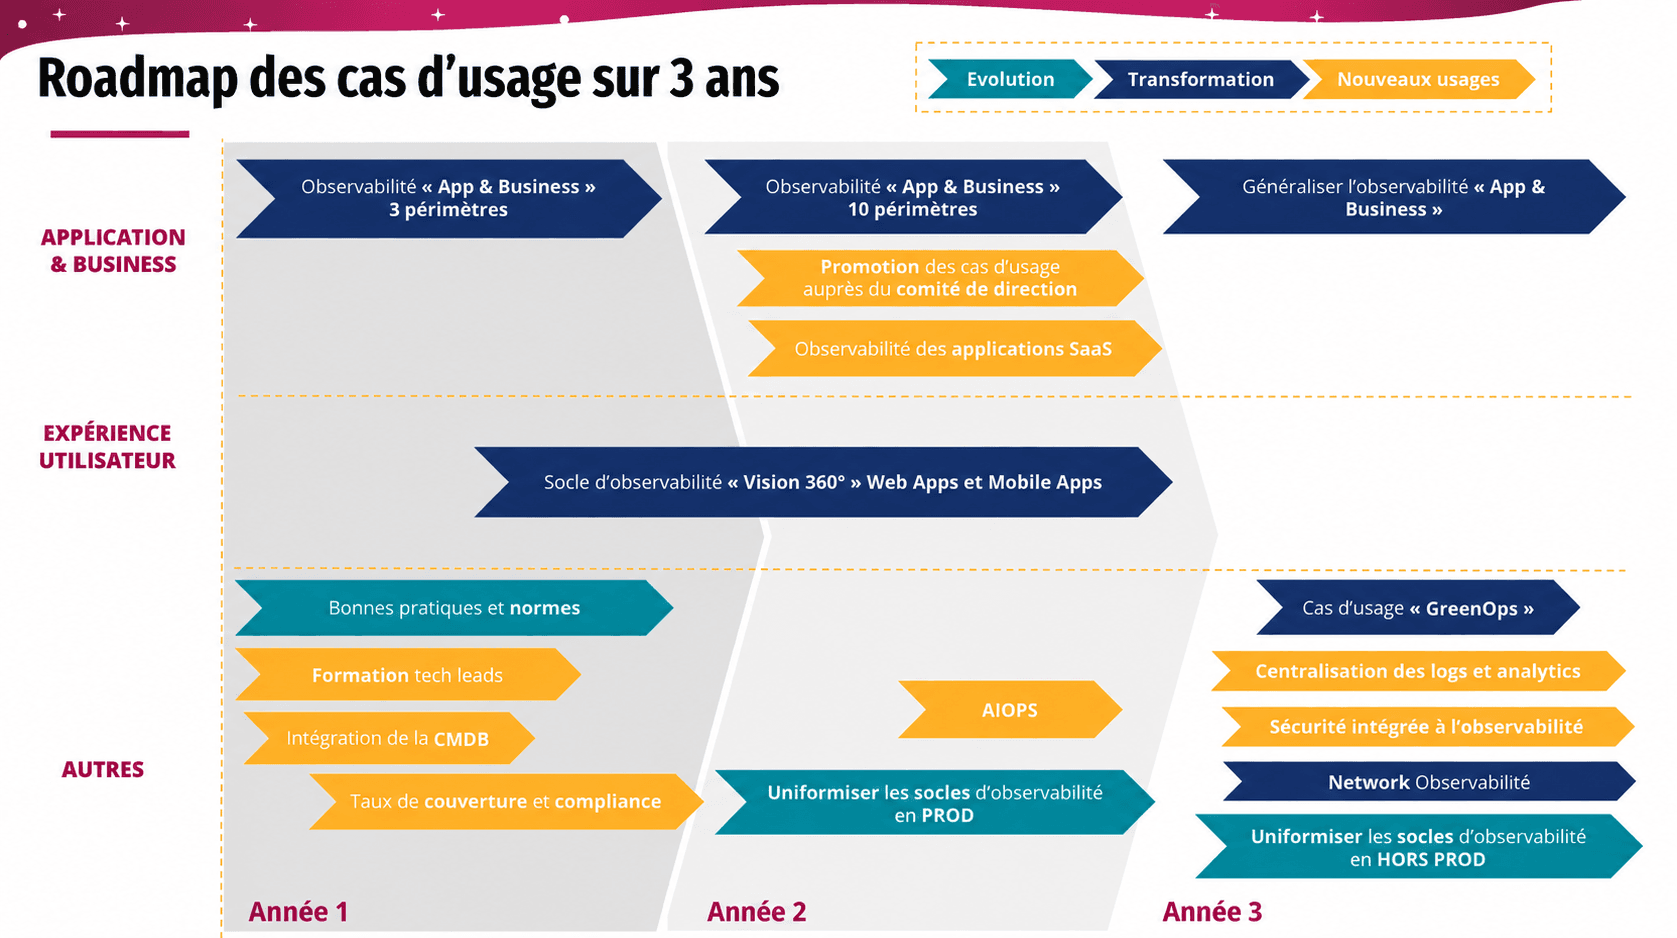
A three-year roadmap: foundations, training and initial scopes come before broader use cases.
Connect observability to operations: 60% less noise
For one client, the challenge was to reduce duplicates and tickets opened in the incident management tool. After the client first worked on reducing alerts, Phenisys helped introduce deduplication before ticket creation.
The workflow distinguishes a new incident, which opens a ticket, from a duplicate or recurrence, which updates an existing ticket. Explicit, traceable rules and monitoring of the workflow itself make the process easier to control. Simplifying routing and enrichment also reduces the number of intermediary tools.
The approach reduced noise by around 60%.
A workflow for recurring incidents
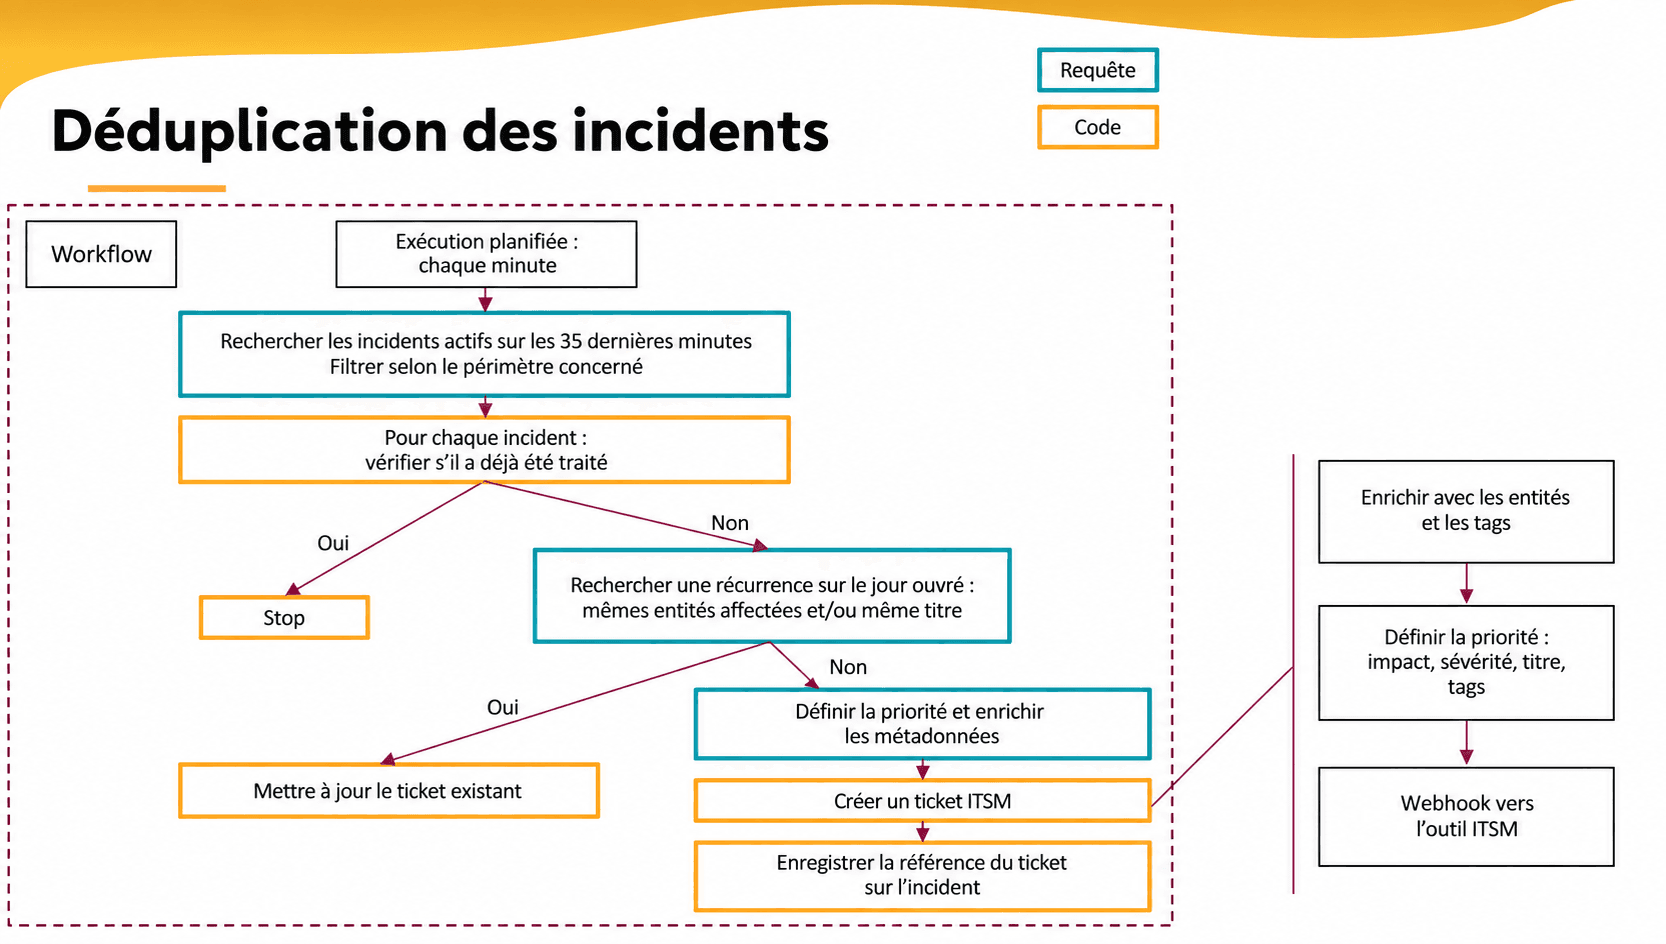
A scheduled workflow retrieves active incidents, skips those already processed, then checks for recurrence using affected entities and/or the title. A recurrence updates the existing ticket; a new incident creates one with priority and metadata. The ticket reference is retained for tracking.
The workflow in the platform and its monitoring
The workflow runs directly in the observability platform and uses its full data context: events, entities, incident context and history. These data trigger interactions with ITSM (IT service management) and feed ticket analytics to decide which tickets to create, enrich or close according to defined rules. Orchestration and monitoring stay close to the data supporting each action.
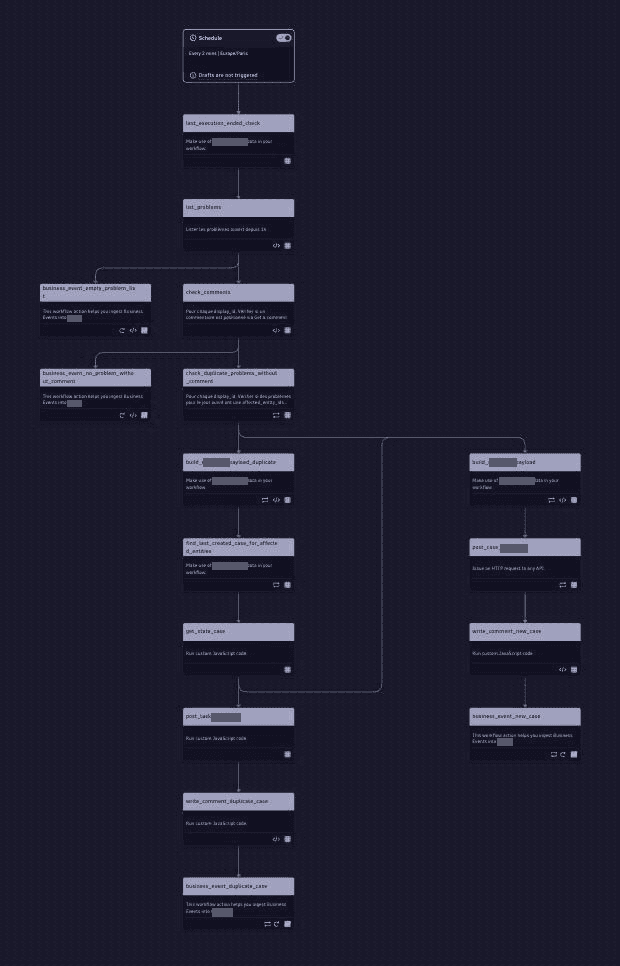
The workflow in the tool: after retrieving incidents and checking comments, branches distinguish recurring incidents from new cases. Steps prepare data, check ticket status and call ITSM, then record comments and events for traceability.
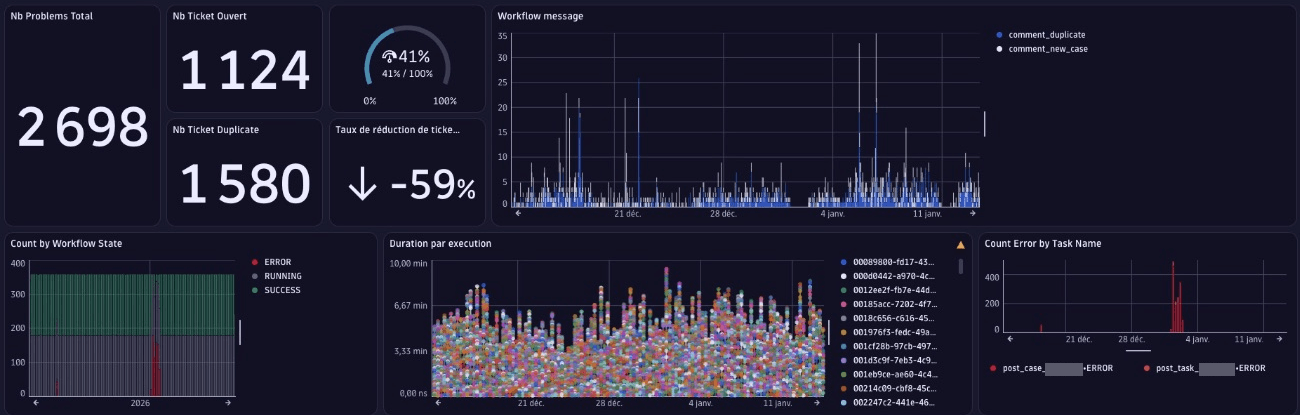
The dashboard shows 2,698 problems, 1,124 opened tickets, 1,580 duplicates and a 59% reduction, or around 60%. It also tracks workflow states, execution durations and errors by task, monitoring both the automation itself and its effect on ticket volume.
Build self-sufficiency from the outset
Adoption starts during the project. We involve teams while building the foundation, run knowledge-transfer workshops and help develop internal champions. Relevant dashboards, simple entry points and shared use cases give teams practical ways to act.
In two engagements, this work continued through the creation of internal user groups. These meetings support knowledge sharing and extend observability to teams beyond the initial core group.
Make continuous improvement part of operations
Once the foundation is in place, our support also covers governance: consumption tracking, coverage and actual usage. These indicators help guide changes and keep consumption aligned with needs.
Connect consumption to use cases
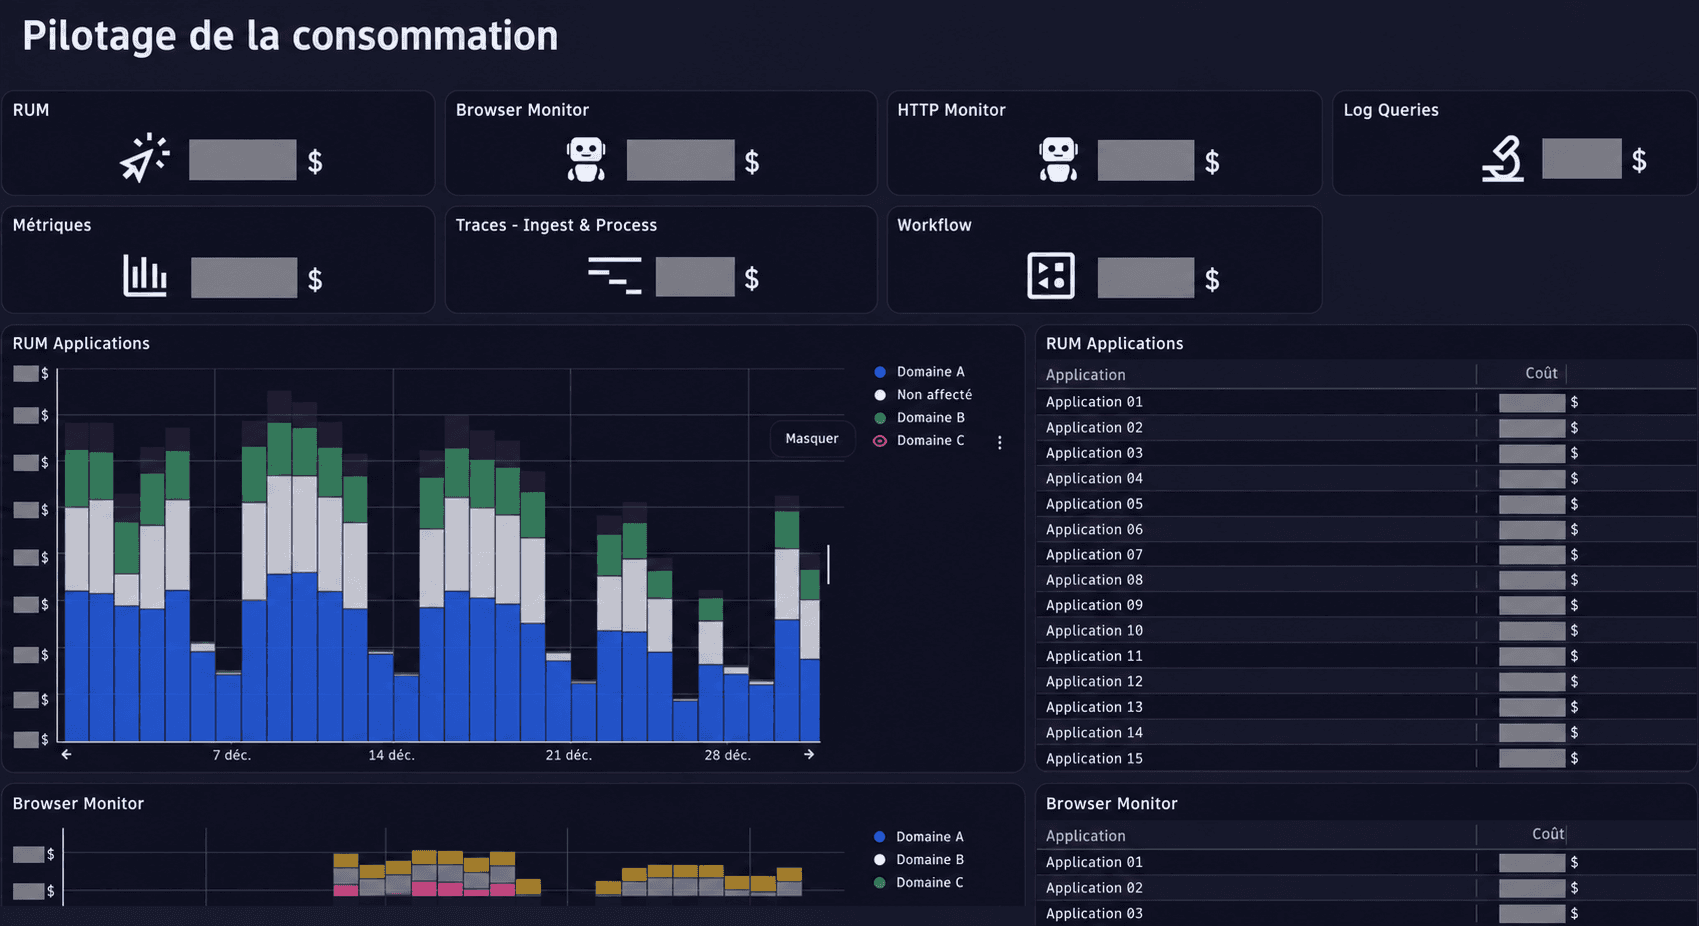
Tiles separate consumption across user experience, synthetic tests, metrics, traces, log queries and workflows. The history and application breakdown help identify areas to investigate and inform decisions with the relevant teams.
Measure coverage application by application
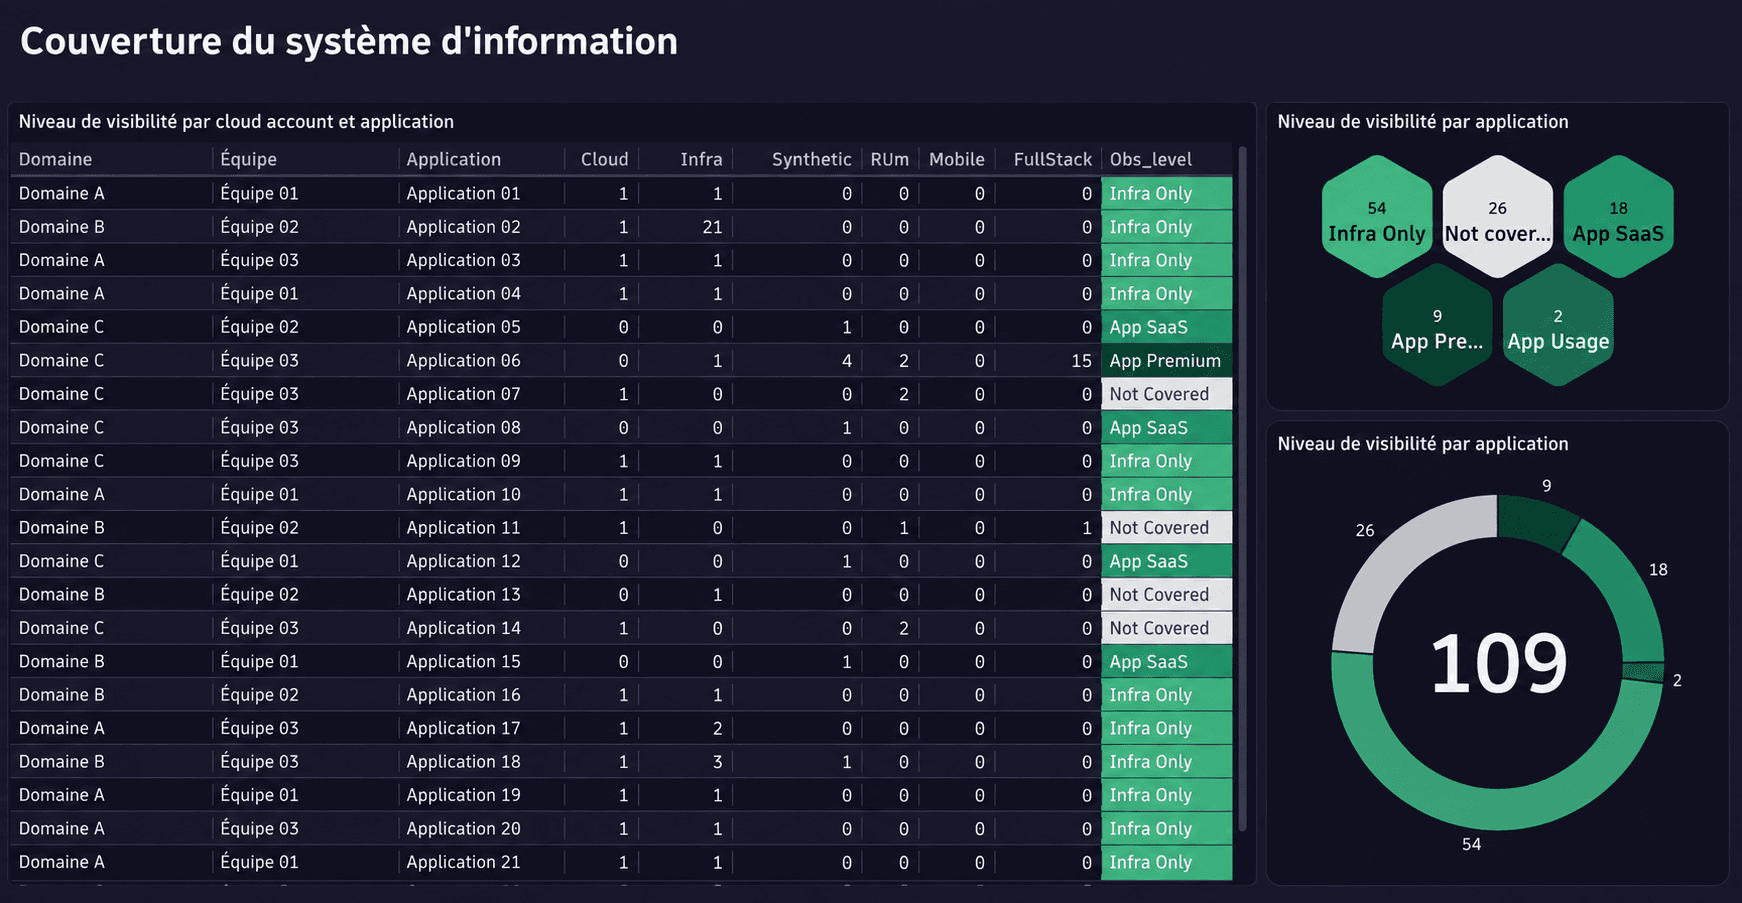
Each row maps an application to available collection methods: cloud, infrastructure, synthetic tests, user experience, mobile and full-stack instrumentation. The summaries on the right group 109 applications by visibility level. This helps identify coverage gaps and prioritize further integrations.
Establish an operational routine
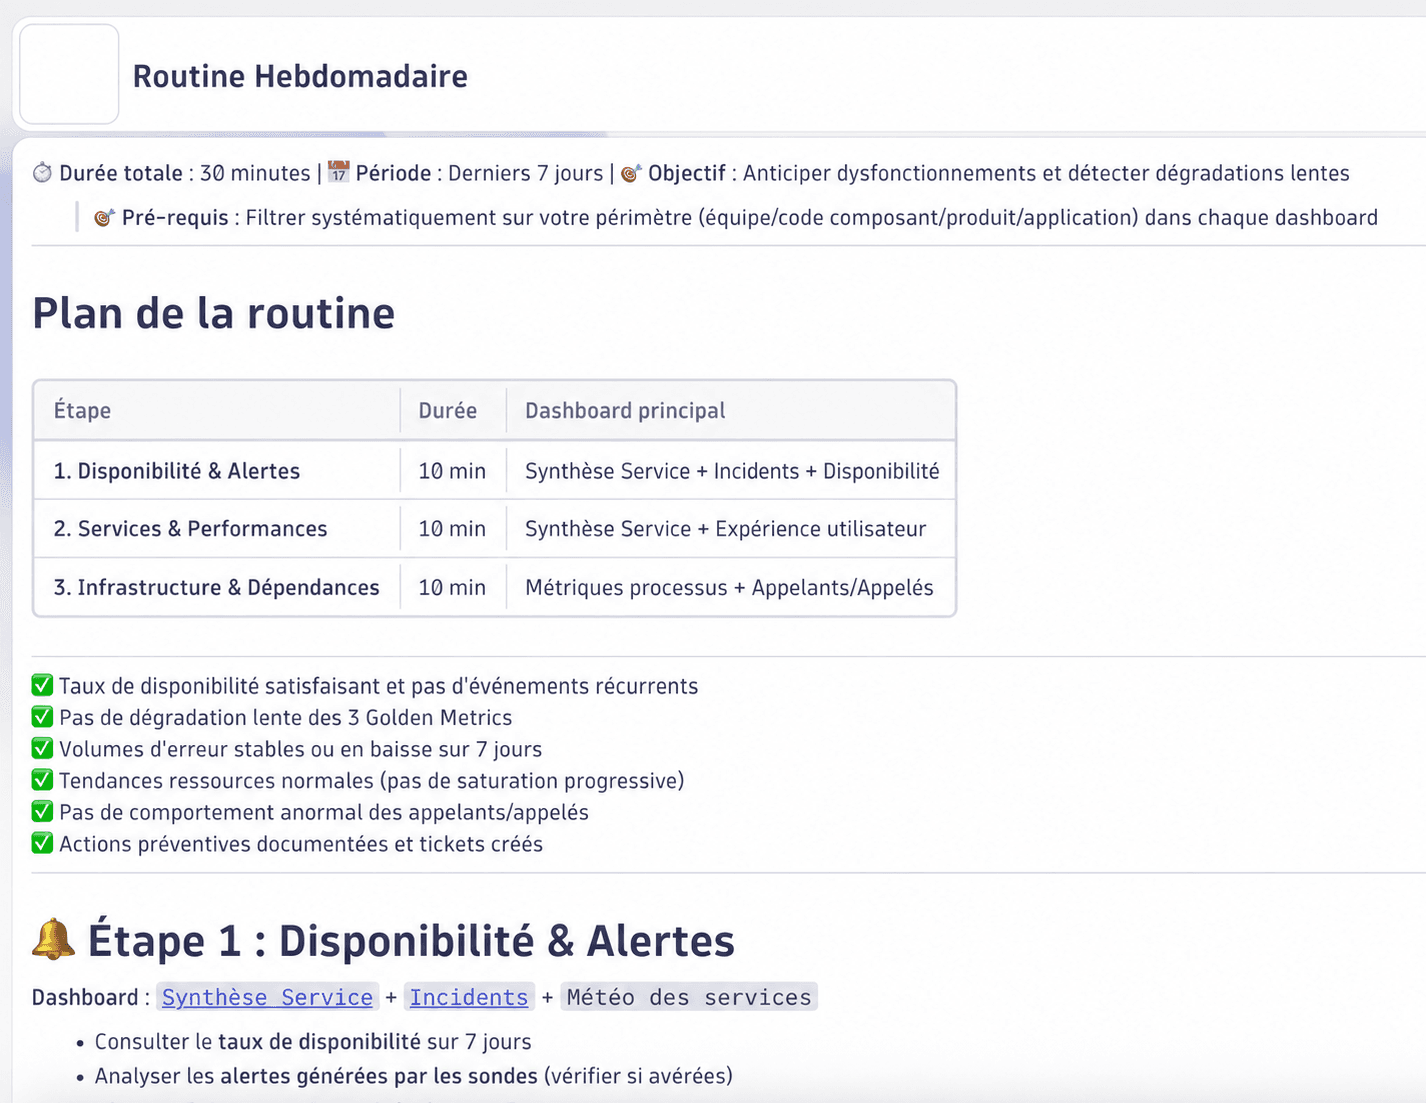
In thirty minutes, teams review availability, performance and dependencies over the previous seven days, then document preventive actions.
Progress also shows in daily platform usage, increasingly precise questions and a reduced need for assistance as teams become more self-sufficient. Workshops and operational routines then inform the next stage of the roadmap.
Phenisys brings this continuity to large-scale observability projects: advice connected to business needs, integration grounded in operations and ongoing support that develops working practices. Planning a deployment or looking to expand the use of your platform? Let’s discuss your priorities.
Other articles
All resourcesDiagnose Microsoft Teams incidents in minutes: try MS Teams Observability in Dynatrace (Demo mode)
Microsoft Teams has become a mission-critical tool for enterprises. Strategic meetings, day-to-day collaboration, telephony, contact centers, when Teams performance degrades, the impact is immediate for end users and for IT teams. The issue is not a lack of data.
Read
Call Center Monitoring for Microsoft Teams: essential use cases to understand and improve your calls
A practical guide to clarify usage, balance call flows, and diagnose Teams calls.
Read
New in Teams Telephony: near real-time call metrology with Microsoft Teams Observability by Phenisys
Microsoft Teams has become the backbone of enterprise communication – for meetings, collaboration, and now full-fledged corporate telephony. But when it comes to call quality, performance metrics, and troubleshooting, most organizations still face the same problem: no clear visibility. That’s exactly what Phenisys is solving with the latest update to Microsoft Teams Observability – introducing […]
Read